
Figure 1

In figure 2, the task Car production transforms (input) resources Steel, Engine etc into the resource Car.
It is important that in demetrix, any of task, resource and link can have an arbitrary number of properties. There is one property, which all demetrix resources and tasks have by default, this is the name of resource or task. All links have two important default properties destination and source. These properties contain names of tasks and resources connected by the link in question.Now we have enough information to start entering own process chains in demetrix.
As already explained before, there are two ways to enter data in demetrix. This is the first way.
Demetrix stores all process chain data in Microsoft(R) Excel(tm) files. That means that you can edit and view all the data of a demetrix process chain in any application, which supports Microsoft(R) Excel(tm) files, be it Microsoft(R) Excel(tm) itself or some other program like OpenOffice.org Calc, which is part of OpenOffice program package.
In order to be able to enter your process chain data via Microsoft(R) Excel(tm), you should understand the structure of the demetrix Excel files. I recommend you first to look at the file example1.demetrix.xls, located in the data directory of your demetrix installation.
A demetrix Excel file consists of three worksheets, one for each of the graph object types (task, resource, link). These worksheets are called - what would you guess? Right, Tasks, Resources and Links.
All these worksheets have same structure. Look at figure 3.

In order to load a process chain, stored in Excel, you have to
The second way to enter data is to enter them directly in demetrix. Next sections are devoted to this second way.
After launching demetrix, the first step is to create a new process chain. This happens by clicking the menu item New from the menu File or pressing Ctrl-N. After that, you are able to create all graph objects (tasks, resources and links) either via keyboard or via the right-click popup menu (using the popup menu is not explained here, because there isn't much to explain - just click into the drawing area with the right mouse button).
You can use following keyboard combinations:

Each time you select a graph object (task, resource or link), its properties are shown in the Properties pane on the left side. Figure 4 shows, how a selected node looks like.
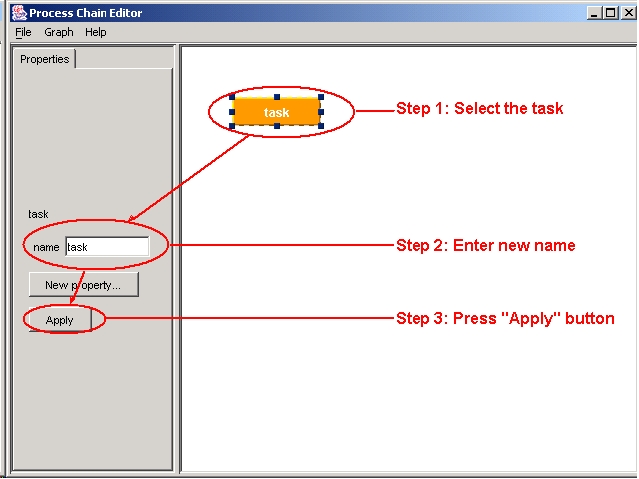
All tasks and resources have the property name. Consider you want to change the name of some task (or resoure). The steps you have to do, are shown in figure 5. After you press Apply, the changes will be saved and the name shown in the task rectangle will be updated.
In order to create a new property, you have to select the graph object and to press the New property... button. After that, you will see the dialog box shown in figure 6. There you have to select the type of property and to enter the name. String properties contain text, double properties contain decimal numbers and boolean properties contain values, which can only be true or false (yes or no).

A balance sheet of a task is a list of all input and output resources of that task. Consider the process chain in figure 1. There, the resource raw materials is an input to the task pre-production and the resource different assemblies is its output resource.
In order to generate a balance sheet for a task, first right-click it. Then, select the menu item Balance sheet... from the popup menu or press Ctrl-B. Then, the dialog similar to the one, shown in figure 7 will appear. You can edit the values in the table. You can also store this report in a Microsoft(R) Excel(tm) file for further processing.

It is also possible to create a balance sheet for the entire process chain. In this case, the balance sheet shows all resources, which either come into the process chain from the outside world (and are consumed in the process chain), or are produced in the process chain and leave into the outside world. System balance sheet can be created using the menu item System balance sheet... from the menu Graph.
Most important decision concerns the format, in which demetrix data are stored. My first idea was to use an object-oriented database Ozone. After a closer consideration and experimenting with Ozone I realized that for the current state of development of demetrix, a more simple solution should be preferred.
Primary reason for choosing Excel was the security that data stored in this format are easy to manipulate, to view and to handle, be it automatically or manually. In other words, if you store your data in Excel, you can be sure that it will be possible to access them in the foreseeable future with no or little effort. The reason for that is the fact that almost any PC in the Universe has Excel (or Excel-like application) installed on it.
Also, almost any user can edit Excel files. This is important because I want to make demetrix an as transparent tool as possible. With transparent I mean the ability to manually reproduce the results of any program-performed calculation. Using a transparent persistence solution is the first step into this direction.
I do not want to rule out Ozone as a persistence framework for the future. As soon as the need arises to manage large amounts of data, we will have to re-think the usefulness of the Excel solution. At the moment, there is no such need.
I am highly interested in ideas about the use of Excel as a data format as well as your ideas about persisting process data. If possible, please send your ideas to the demetrix forum, mailing list or directly to me.
As already mentioned above, all data of tasks, resources and links are stored in so-called properties. Figure 8 shows the UML diagram of the property architecture.

Main motivation to store class data in properties rather than attributes is to minimize GUI programming effort. If data are stored in a standardized way, it is easy to automate the generation of UI forms. Using SwixML further helps to reduce UI related programming effort. Example for automatic generation of UIs is the Properties panel of demetrix-0.0.1.
Another reason for using the property architecture was to enable the user to adapt the data model to his/her particular needs. Imposing a strictly defined data model may restrict the usefulness of demetrix, for instance, if the not all of the data required by that data model are available in a particular case.
So, demetrix buys a greater flexibility by transferring some of the thinking work from the developer to the user. In my opinion, writing, say, a bill in Excel is more convenient than doing it using some batch program, even though you have to think more, if you use Excel. Demetrix is intended to become something like Excel for process models.

First of all, I want to thank Van Woods for the idea to use JGraphT.
demetrix uses JGraphT for internal graph representation and JGraph for the visualization of graphs (figure 9). I think, this is a good combination. Using JGraph for internal representation of graphs was more complicated than using JGraphT.
In order to accomplish a task successfully, you need motivation. In order to get motivation, you have to know, what your goal will be, once the current task is completed (see figure 10).

Setting higher and higher goals will lead you to higher and higher performance. There also has to be some great vision, which needs not be realistic, yet needs to be powerful enough for you to try to attain it despite all difficulties and required working and thinking efforts.
Some people (like me) experience productivity slowdowns, if they know that there is no tomorrow after a particular task is completed. Under such circumstances, a couple of lines of code may take a couple of days to be completed.
I will sketch some of my ideas concerning the future of demetrix and encourage you to invent your own vision of how demetrix can be useful or at least interesting for you.
I am highly interested in feedback concerning the demetrix stuff produced so far. Good software is the materialization of good ideas, therefore I regard it as vital for the survival of demetrix to create a community of actively interested people.
This should be a first useable and stable version of demetrix. This task encompasses
At the moment, it is only possible to create process models. However, as stated in the Vision Document, demetrix should enable the user to create both process structures and resource structures (i. e. to create graphs, which show the composition of resources).
Implementing this feature will make demetrix useful for a new class of calculations, for instance, calculation of the disassembly time of a product.
As explained in the description of the demetrix project, it should be based on well-established methodologies for process modelling. Yesterday I received the paper copy of an article, in which the STN approach is described. I will upload all my materials about STNs and RTNs as soon as possible.
For the time being, you can look at the thesis Improving Computer-Aided Process Plant Scheduling and Design by James D. Bloom. It contains a description of the STN and RTN approaches for plant scheduling in chemical industry.
I intend to implement the STN and RTN algorithms step-by-step, proceeding from simple to more sophisticated aspects of them.